Advert:
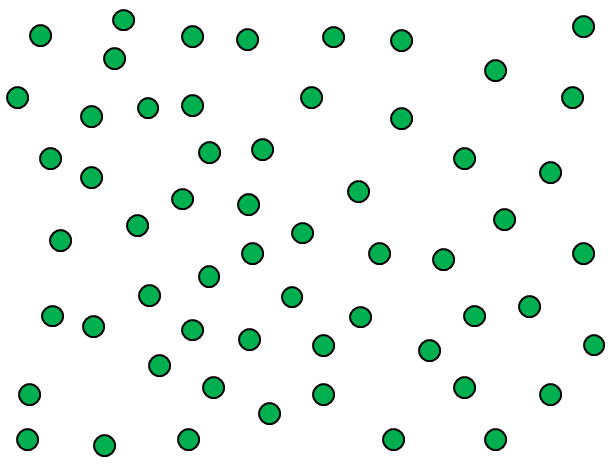
Below you will find a certain number of dots. Have a very quick look at the dots above, then scroll down the page until you can’t see them any more
Keep scrolling!!!
Keep scrolling!!!!
A little more!!!!
How many dots do you think there are? No cheating, just write down your first estimate.
Now, get your class to do the same. Show them the image of the dots for less than a second, get them each to write down their guess, make them promise not to change them, and then quickly go around the class and collect their guesses together, recording them on the board.
In less than three minutes you have created a data set. It may not look like the most interesting data set, but to your pupils it is, for the simple reason that they have created it. Perhaps more importantly – and you will have to trust me on this until you try it for yourself – your students are absolutely desperate to know how many dots there are and will do almost anything to find out.
But, of course, you do not tell them yet as you have hooked them in and there is plenty of important mathematics that you can do with this little set of data.
Firstly, we can work out the mean, median, mode and range of the guesses. In my experience, the range is one of the least understood concepts in mathematics, but in this case your students have a clear, tangible understanding of what the range is: it is the difference between their lowest guess and their highest guess; it is a measure of the spread of the class’ guesses.
Once you have done this, why not compare the results with another class who has carried out the same experiment? Which class were the better estimators? How can we tell? Your students will be arguing about whether the mean or median is a better measure of average in ways they would not have previously done, simply because they own their guesses, they own the data set. They will be interpreting data, and more importantly understanding what they are saying.
Finally, comes my favourite. Without revealing anything, offer your students the opportunity to stick with their original guess, or change to something else. Record this new data set on the board and ask students to predict how the mean, median, mode and range might change. The results are fascinating. The range tends to diminish rapidly as over and under estimators sheepishly converge to the norm, and the mean tends to either rise or fall in line with the guesses of the most vocal, confident students. Perhaps most interestingly of all, due to a phenomenon known as “The Wisdom of the Crowds”, the mean of this second data set tends to be further away from the true number of dots than the first set of guesses.
By the time you have created stem and leaf diagrams, histograms and cumulative frequency curves from the class’ data, you have filled several lessons and covered most of the handling data requirements for the GCSE syllabus, all with a single set of dots.
Oh, and there were 58 dots, by the way.